dafni
Some fsl/bash tricks
Aims
The aims of this page are:
- show you a couple of command line tricks for creating images / stats with exisiting
fsltools - explain a bit more about the intermediate and summary results of a
fsl/FEATanalysis so you can make use of them - point you in the right direction for finding more help
You might find some of this helpful for completing the assignment - but also for future reference!
Assumptions
To give you some concrete examples, I assume you are running Terminal and have access to the dafni dataset 1 (which should be stored in S001 unless you made some deliberate choice to rename at some point).
If you are using a different dataset, adjust accordingly. Names inside feat directories are consistent (a nice design choice by the fsl team).
Raw data files are:
dafni_01_FSL_2_1.nii
dafni_01_FSL_3_1.nii
dafni_01_FSL_4_1.nii
dafni_01_FSL_5_1.nii
dafni_01_FSL_6_1.nii
dafni_01_FSL_7_1.nii
The folders produced by FEAT are these:
dafni_01_FSL_4_1.feat/
dafni_01_FSL_6_1.feat/
Code snippets, ideas
- Opening the html report
- Turning anatomy file into animated gif
- Turning anatomy file 3-midsection view/PNG
- Rendering stats images
- Rendering stats images (highres)
- Opening rendered images in
fsleyes - Identifying clusters (from labels)
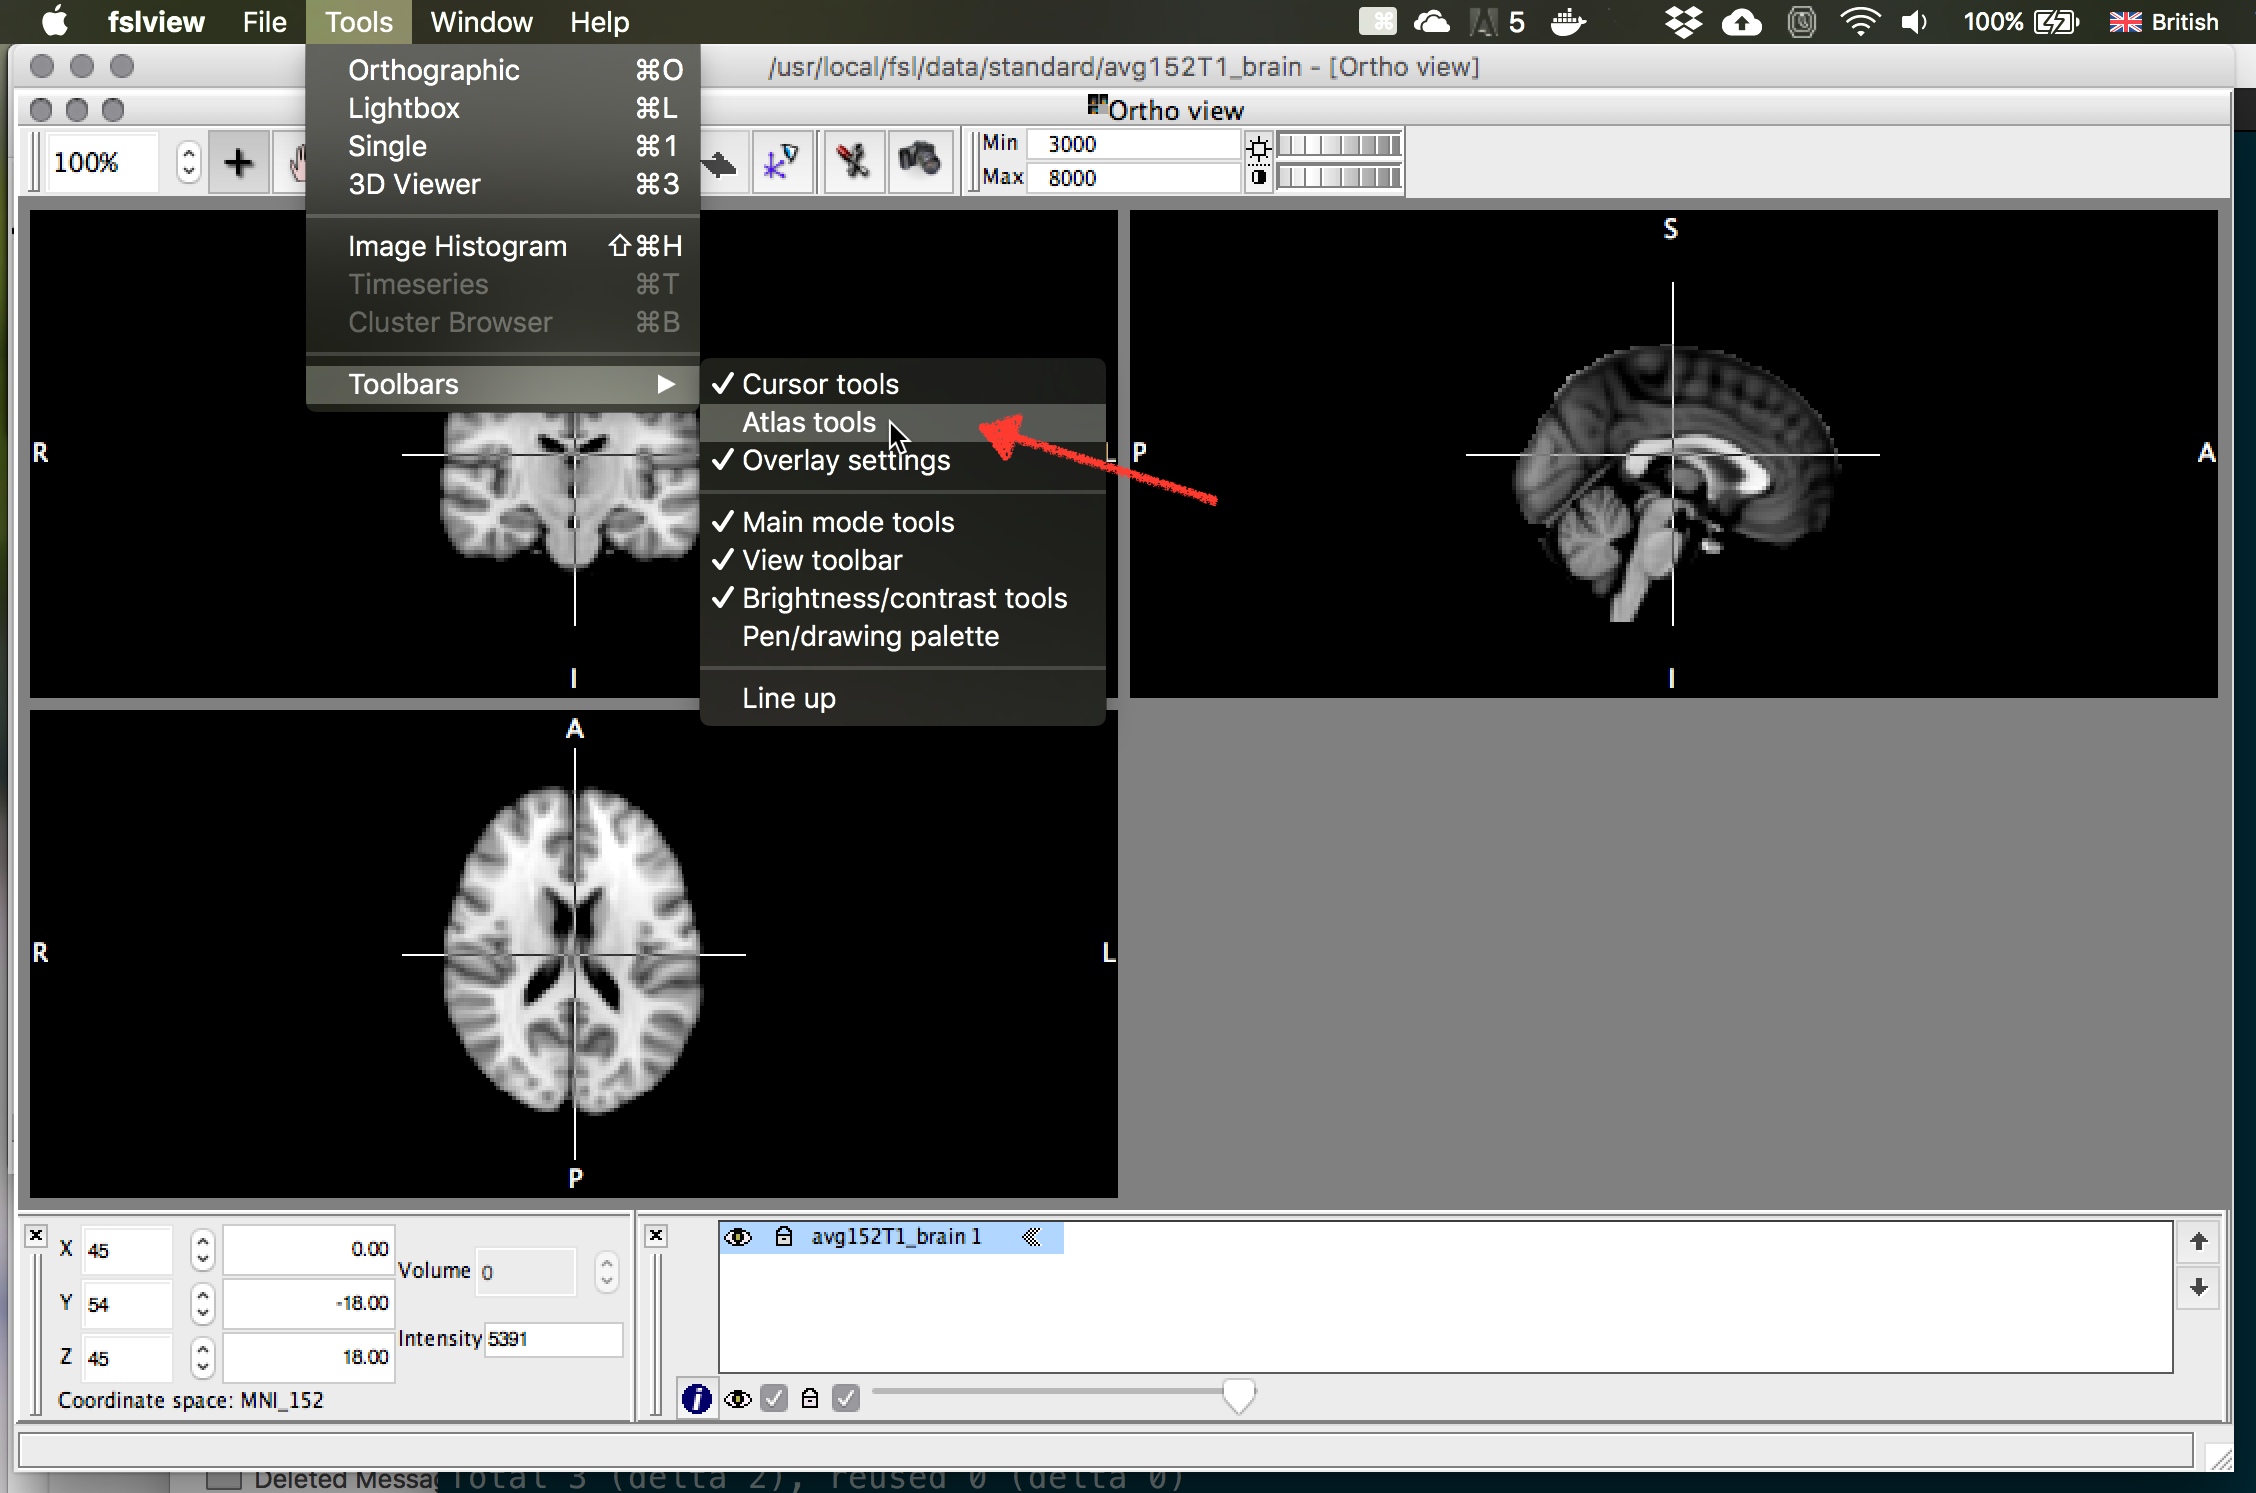
- Switch on atlas tools
- FSL command line tools, bet, …
- Get mean timecourse in ROI
- Motion correct two fMRI scans and “average” them
Opening the html report, Finder
Don’t forget to use TAB-completing whenever you can!
cd ~/S001
cd dafni_01_FSL_4_1.feat

# pop up report in browser
open -a "Google Chrome" report.hml

# pop up current folder in Finder
open .
Turning anatomy image into animated GIF
pwd
# make sure you are in dafni_01_FSL_4_1.feat

# turn anatomy image into animated GIF.
# leading to facebook and twitter happiness...
fslanimate dafni_01_FSL_3_1.nii inplane.gif

# pop up report in browser
open -a "Google Chrome" inplane.gif
Turning anatomy image into mid-slice image (for report?)
pwd
# make sure you are in dafni_01_FSL_4_1.feat

# turn anatomy image into animated GIF.
# leading to facebook and twitter happiness...
slicer dafni_01_FSL_7_1.nii -a S001-midplanes.png

# open in preview
open S001-midplanes.png

# learn more about slicer
slicer   # without input args
Rendering stats images
Lots of info / help on how to use a GUI tool called Renderstats_gui on this FSL wiki page
pwd
# make sure you are in dafni_01_FSL_4_1.feat
Renderstats_gui &
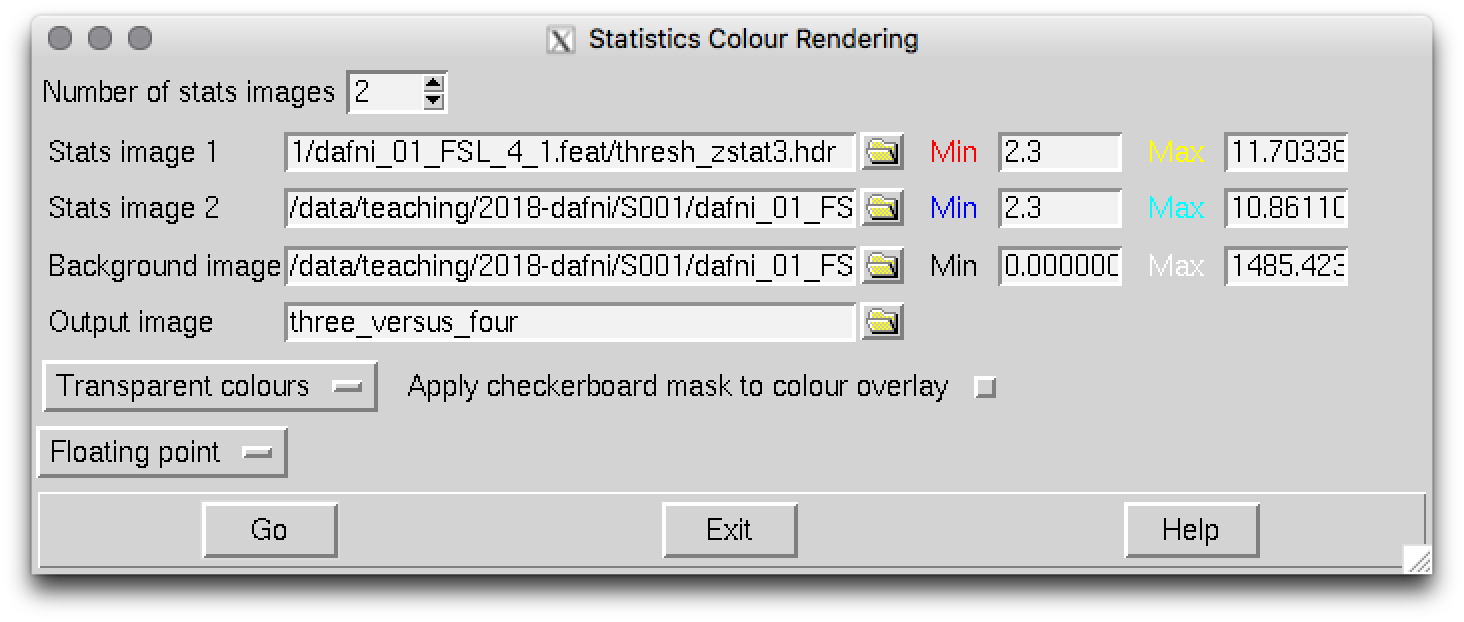
Then make 2 stats images overlay by increasing the counter to 2 and loading in the images you want to overlay. Here I have chosen to redner thresh_zstat3.hdr in red colors, and thresh_zstat6.hdr in blue-ish colors. Make sure start thresholding at a reasonable Z-value (2.3 is what would have been set in the options in your FEAT analysis). I called the output image three_versus_four but thats up to you to decide…
With this new combined image, you can now call slicer again to do a nice summary
slicer three_versus_four.img -a stats_test.png

# and look at it in Preview
open stats_test.png
NB! slicer has many other options - play around with them. These datasets also lend them to showing all axial slices in a montage… as there is a nice medial/lateral dissocation in the blobs.

Rendering on high-resolution anatomies
If you have registered your data into standard (or another high-resolution) space, you can also get FEAT to make nice, superimposed images with the following:
pwd
# make sure you are in dafni_01_FSL_4_1.feat

Renderhighres_gui &
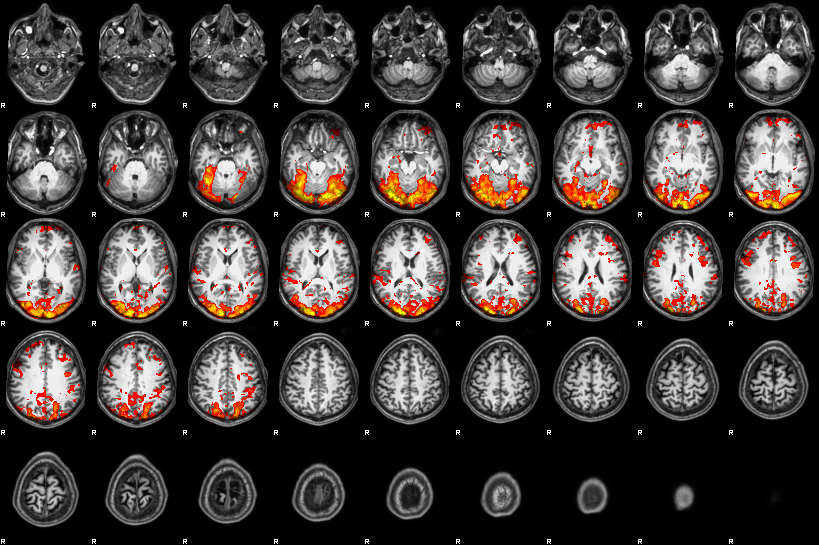
Select the .feat directory you want to “convert” and click “Go” to let the conversion happen. This will create a subdirectory called hr which you can inspect - by default this tool also produces a .png image montage (although you can use the slicer command [see above] to get more funky).
Opening rendered images in fsleyes
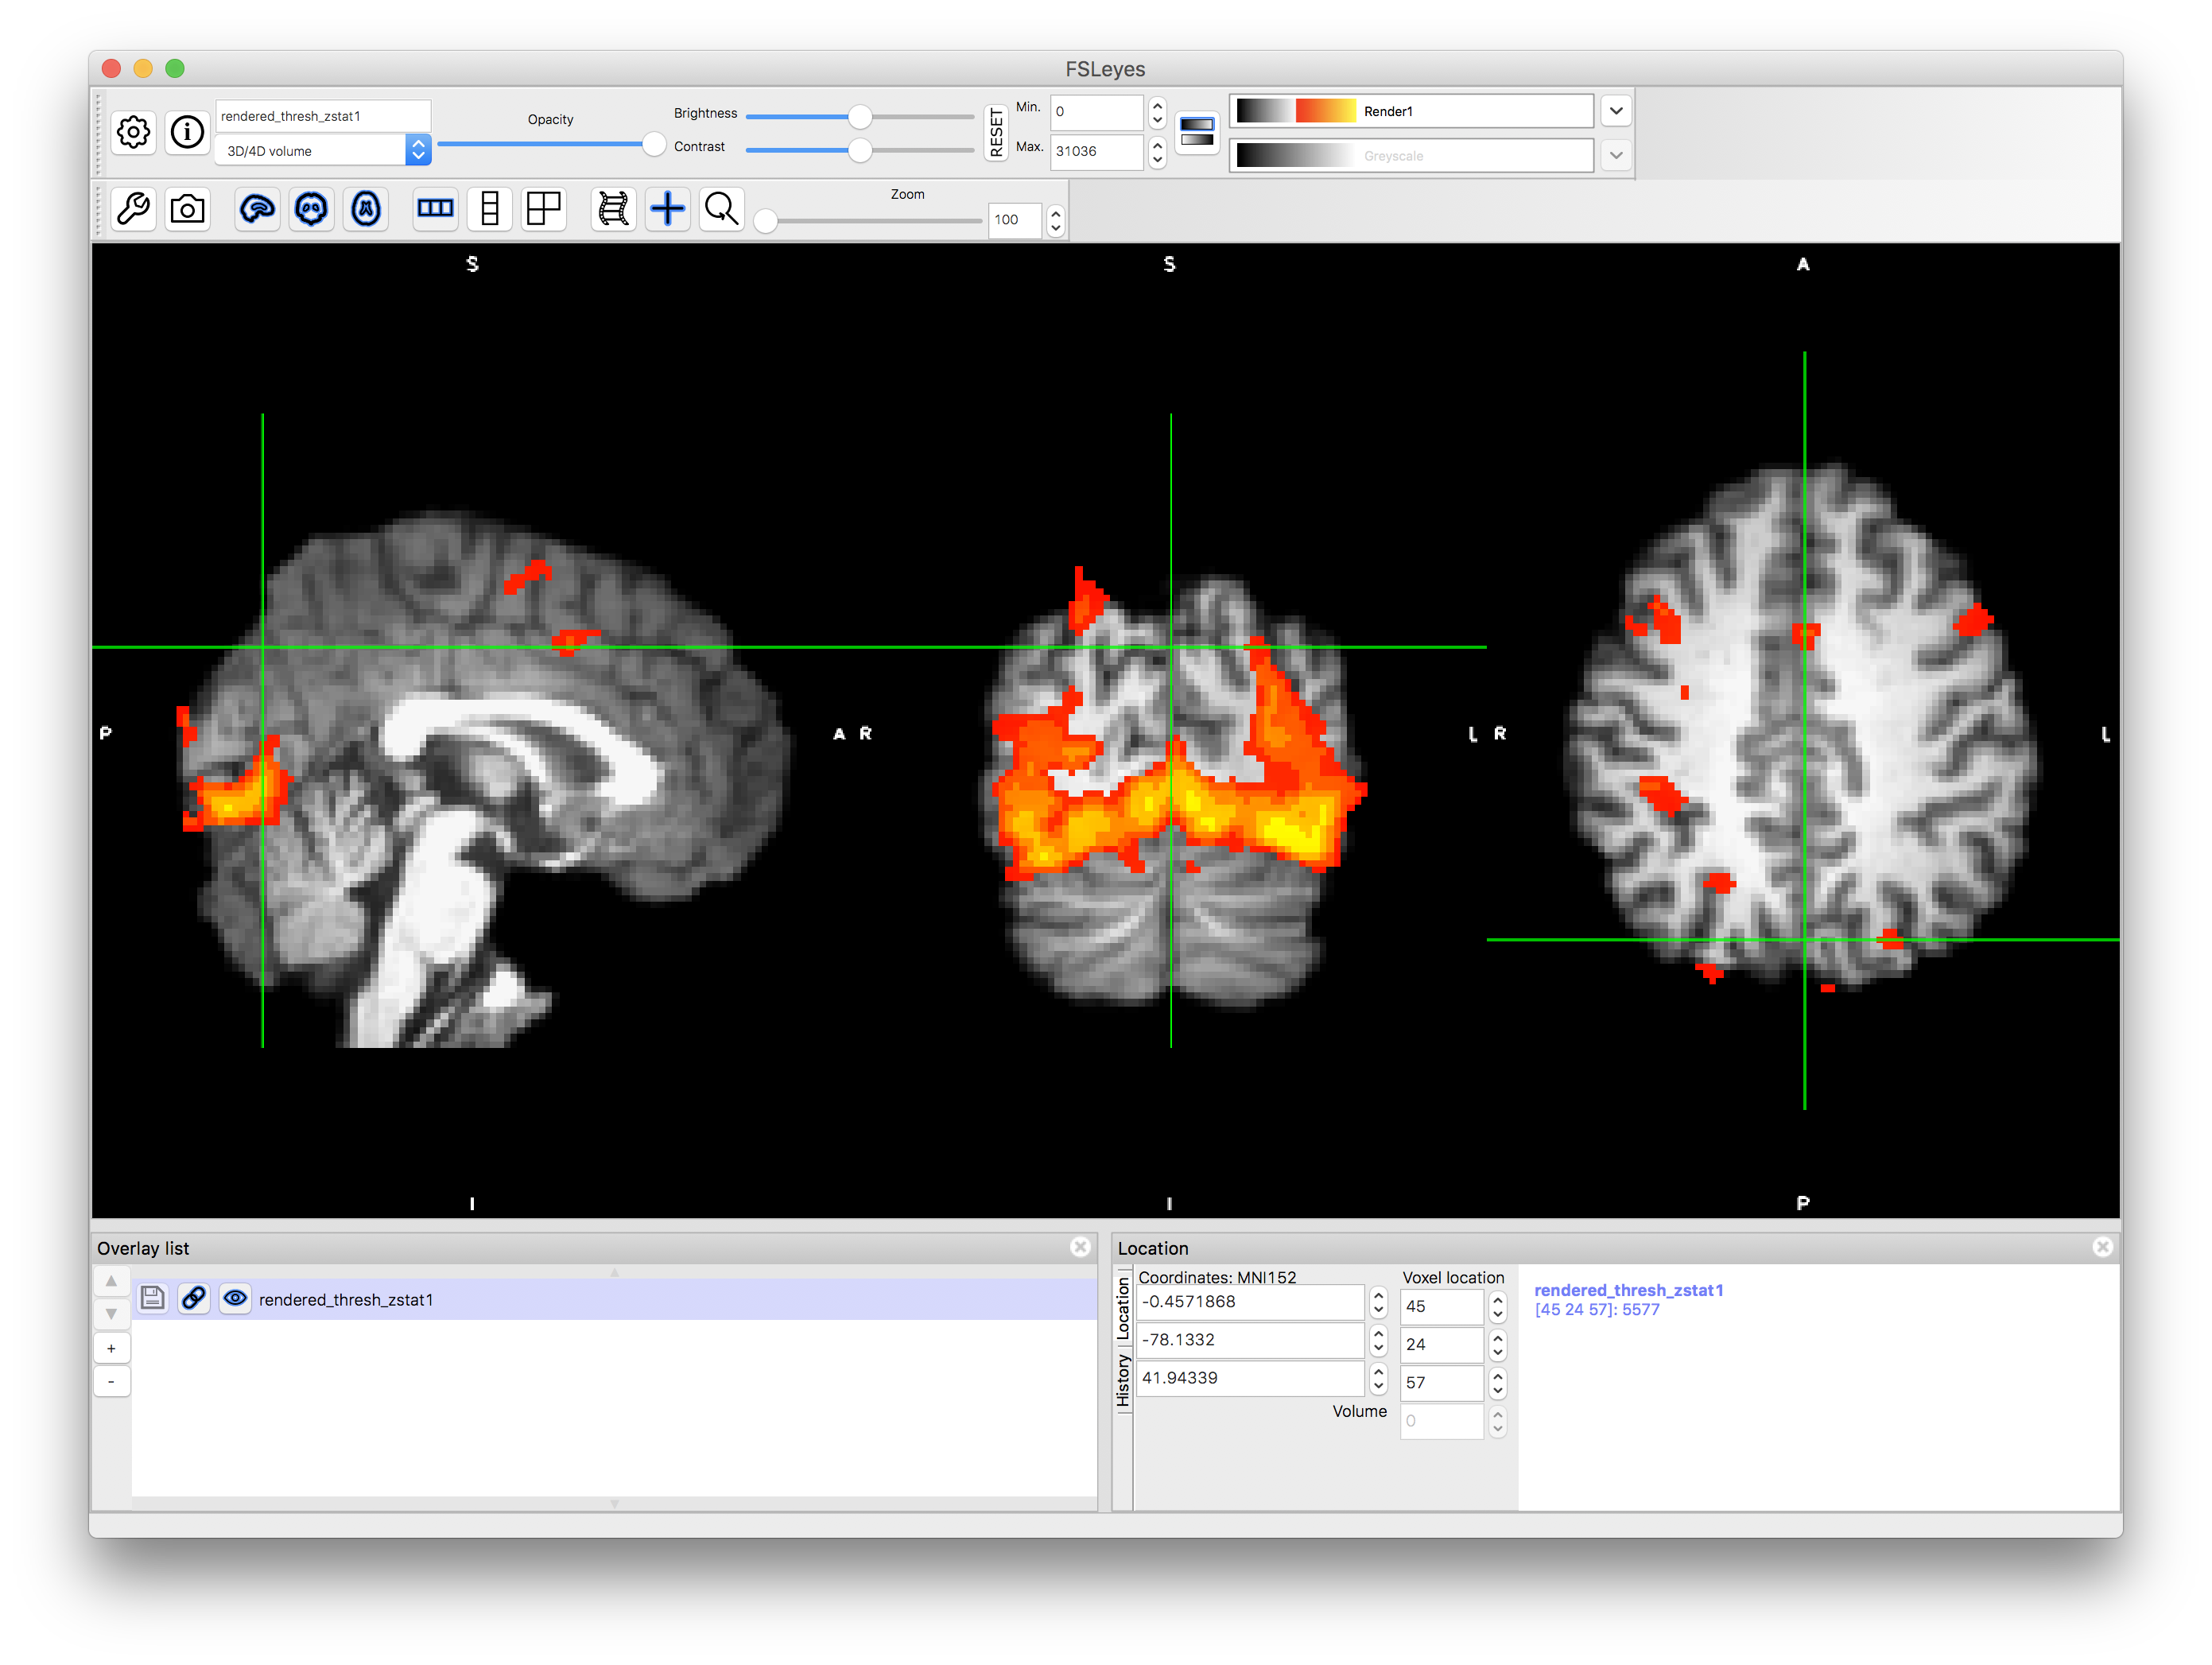
fsl keeps a copy of the rendered images as nifti files. If you want to use the viewer programme fsleyes to look at them, you need to make sure you are using the corrct color map (command line option -cm)
# to look at the rendered thresholded map for contrast 1
fsleyes rendered_thresh_zstat1 -cm render1 &

# and if you have overlaid onto a high-res, you an also try
fsleyes hr/rendered_thresh_zstat1 -cm render1 &
Which cluster is which?
To visualise the cluster assignments that FEAT does, you can inspect
pwd
# make sure you are in dafni_01_FSL_4_1.feat

# load up fslview (with a EPI image as default bg)
# fslview example_func &  # older versions of fsl!

# newer versions.
fsleyes example_func &

# File -> Add from file... and choose e.g. cluster_mask_zstat4)
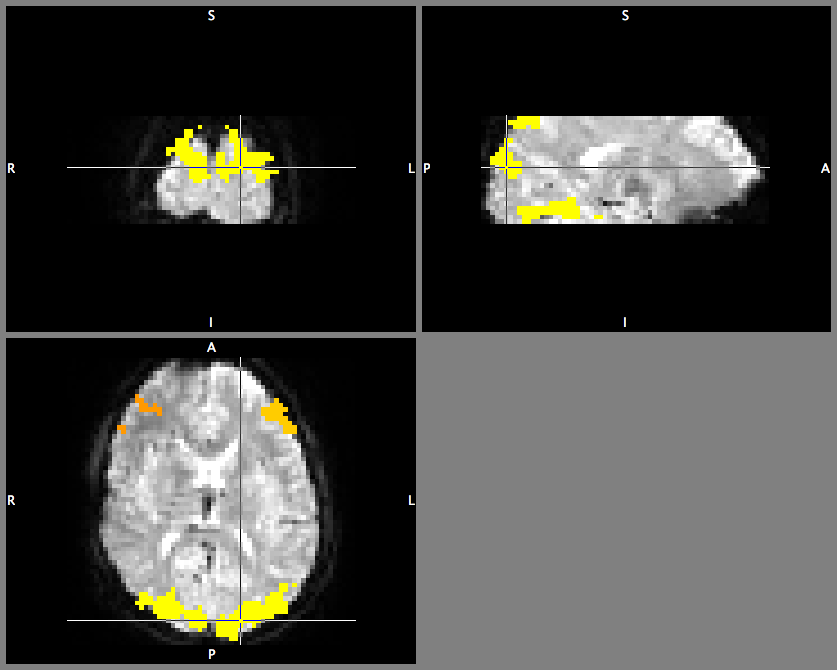
If you look at the superimposed image… you will see differently coloured regions corresponding to value (cluster) 1, 2, …
There are also ways to further use this (logical) information - think of them as “masks” or “regions of interest” which are all stored together in one image. You could combine info about “where is the cluster index == 4” with “where in another statistical image are there significant responses”.
If you want to try this out… you can search documentation. Hint:
fslmathswith options-thrSOMENUMBER-uthrSOME_other_NUMBER-bin-maswill allow you to do some of those things
These are interesting things to do - but the nitty-gritty may be beyond the scope of this class. Questions: don’t hesitate to ping on moodle forum.
Activate atlas tools
If you are looking at an image in Standard space (e.g. the MNI 152 average), in fslviewfsleyes you can activate the atlas tools to find out where you are, w.r.t. a probabilistic atlas. Check the help for more details.
Using fslmaths, bet2 and other tools in command line
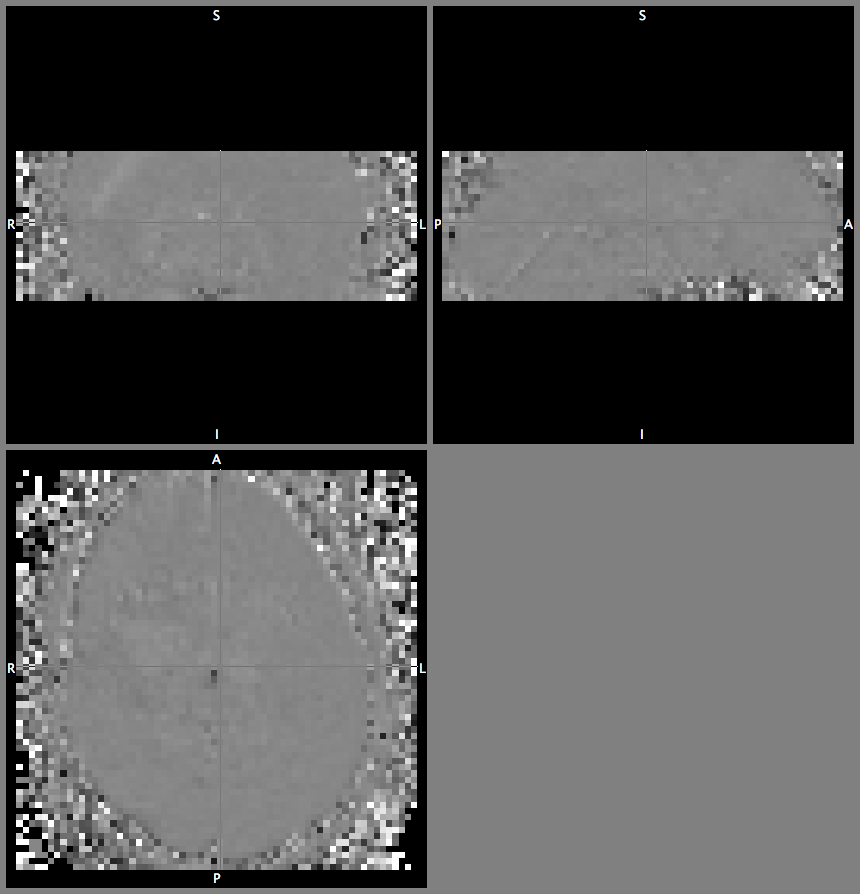
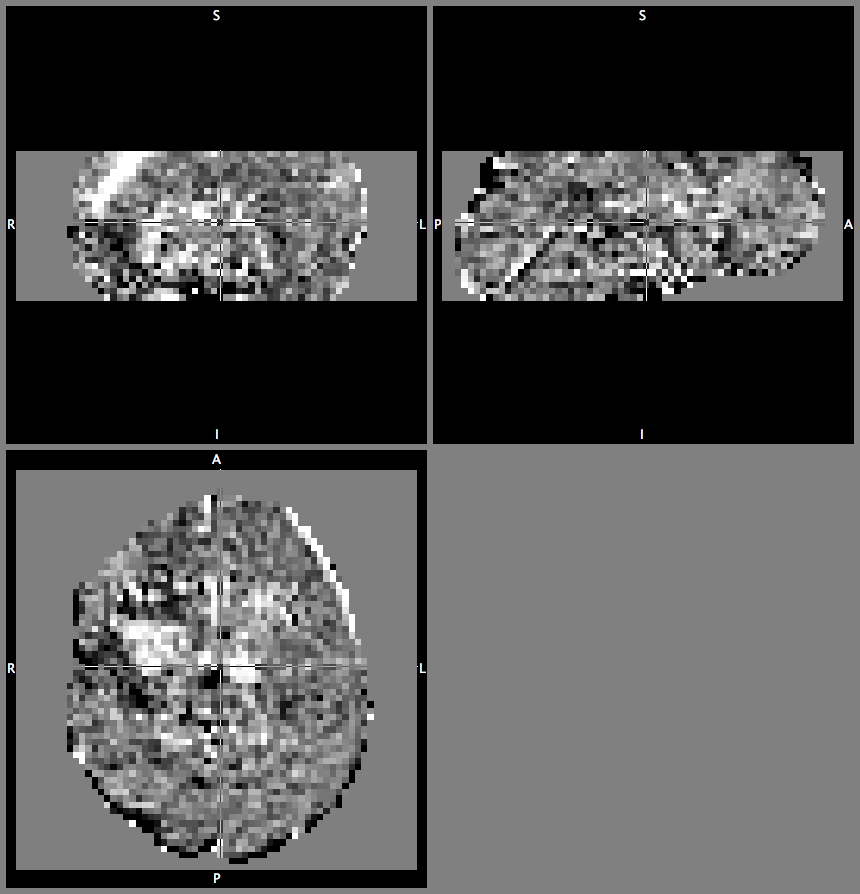
Have a look at the example bash script called example_fsl_analysis.sh to see how you could use low-level command line tools extract a time course (fslmeants) ror do skull-stripping (bet2) or simple maths with the images (e.g. for calculating percent signal change).
If you copy the script into the folder that contains your data (so, inside S001`), then you can run the following command in the terminal - or better copy and paste individual lines one by one from the text editor and run them in sequence
sh example_fsl_analysis.sh

# or better
open example_fsl_analysis.sh
# copy and paste into terminal and use ls and
# fsleyes / fslview to see what's happening
and after some cleaning up and masking - the final image looks different
Getting mean time series across an ROI
There is a short video showing you how you can use (and create) a region of interest (aka mask) with the command fslmeants. Use this in combination with the other tricks to get data at the command line. The other option is to load raw data into Matlab and manipulate there.
- link to youtube clip
- I have also made the command history of what I typed into the prompt available in this file here. Have a look at this, too.
Averaging to fMRI scans with same timing (after motioncomp)
Assuming you have two fMRI scans that are exact repeats of the same experiment, say a visual experiment with same stimulus order… one thing you might want to do is to simple average them: take an average of the first time point in both scans, then the second time point, etc. This is a quick and dirty way of combining data - maybe running statistical analysis on each file separately and then combining those would be better… but it’s still useful to have this trick up your sleave!
Let’s say you have scan1.nii and scan2.nii
Idea:
- take the first time point of
scan1and use this as a reference for motion compensation - motion comp both scans (using that reference)
- use image maths to combine the timeseries data into one average
# 1 - use fslroi to slice of 1 timepoint starting at 0
#
fslroi scan1 ref 0 1

# 2 - use mcflirt command line using this new 'ref' file
mcflirt -in scan1 -out scan1_mcf -r ref.nii
mcflirt -in scan2 -out scan2_mcf -r ref.nii

# 3 - now use fslmatnhs to do voxel (and timepointswise addition and divide by 2)
fslmaths scan1_mcf.nii -add scan2_mcf.nii -div 2 scanAv

# 4 - inspect result:
fsleyes scanAv.nii
Other ideas
- command line stats using
fslstats - simple image manipulation with
fslmaths
Ping me, if you have questions or suggestions.