dafni
Brain images + timecourses in Matlab
The aims of this lesson are:
- refresh your memory about
matlab - see how to load
niftiimages (pre-2017b we need a toolbox, now support is native). - make some bespoke plots with data from your
spmsessions.
Matlab, two ways…
Before we dig in
- paths in matlab? How does Matlab know where code is?
userpath()- functions, versus scripts?
- making an “essay” plan for your code [some advice]
- how to make bespoke plotting code (interactive)
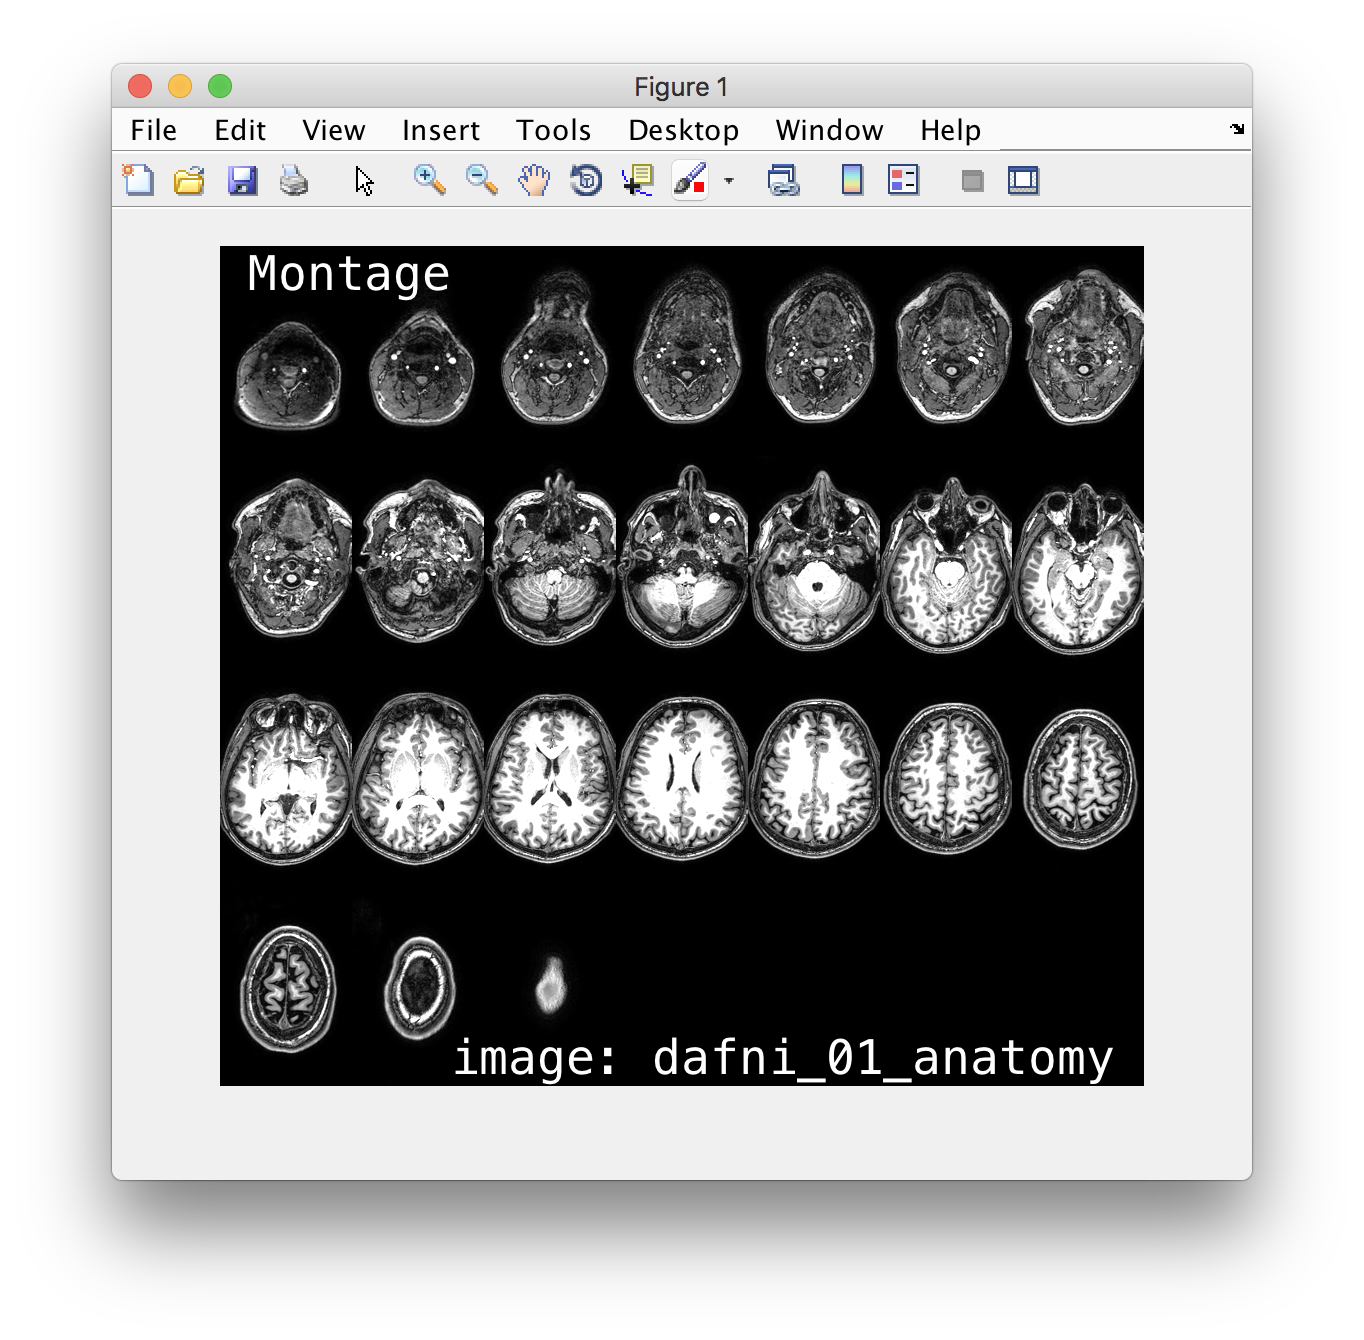
makeMontage()
For the first part of the session, I will do a coding walk-through with some narrated advice on problem solving, etc. In the second part of the session, you will then apply the ideas from the first part of make your own function for extracting timecourses from data.
- we build a simple
makeMontage()function for displaying 3d imaging data. Plan out / design / writemakeMontage() - thinking about putting your code under version control!
If you want, you can also have a more detailed look at the files and exercises in the matlab_images folder.
returnTimecourse()
In the second part of the session, we want you to make use of the ideas we introduced in the first part to:
- think about, draft, and write a function called
returnTimecourse() - it should take 4 input arguments
data,xcoord,ycoordandzcoord(the coordinates could be in the format thatfsluses… in particular, start counting at 0, not 1 like matlab…!! FSL and SPM use different conventions) - your function help / documentation should explain this behaviour to make sure your users don’t get confused with it.
- and should return 1 ouput (call it
tcourseinside the function)
This would give you a function signature like this:
function tcourse = returnTimecourse(data, xcoord, ycoord, zcoord)

% code

end
You can then reuse this code/function elsewhere:
% SPM data...
% identify fMRI scan and interesting coordinates..
% use it like this...
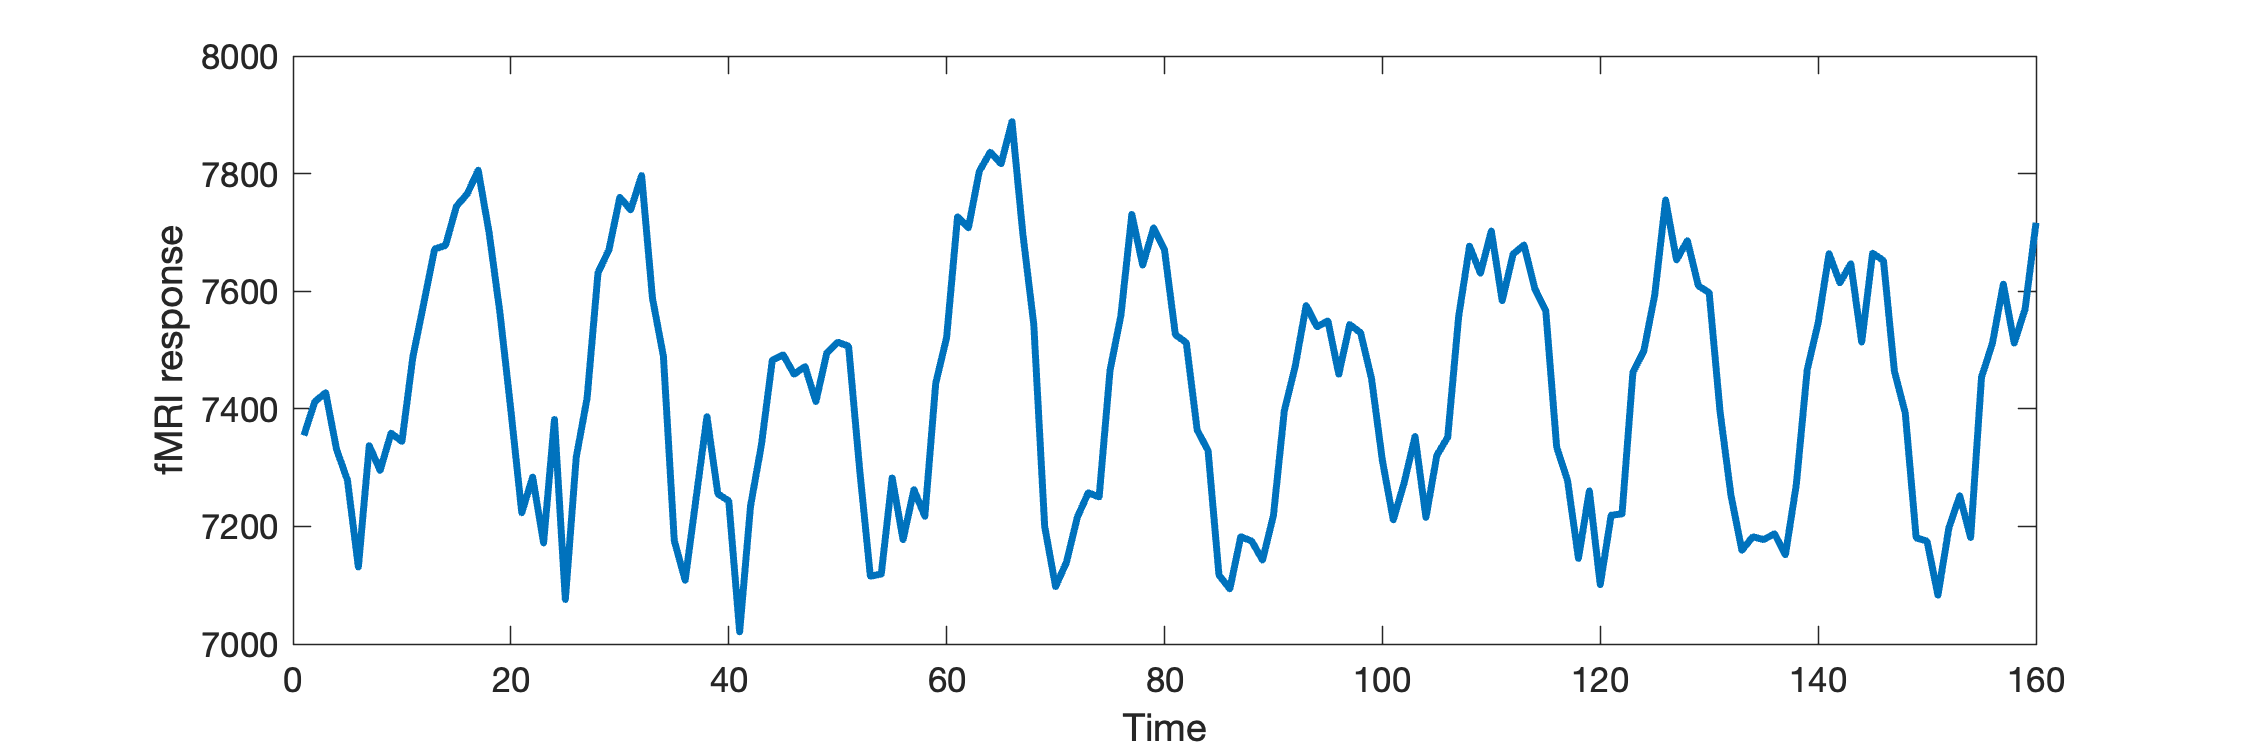
t = returnTimecourse(data, 30, 5, 2);
plot(t, 'linewidth',2)
xlabel('Time');
ylabel('fMRI response')
FSL/FEAT equivalent
If you had data analysed in a FEAT session, you could look at the pre-processed data like this:
% so you can use it with
cd('fmri.feat') % go into the folder
data = niftiread('filtered_func_data.nii.gz');
Applying this for spm data
- see example code for how to start using data stored in
spmconvention for plotting with vaniall matlab.
plot() throws errors
- if you get weird errors from
plot()then check whether you are doing the right thing to get a 1-d vector for plotting (maybe check withsize()?!)
Follow-up, solutions (a bit more advanced)
-
have a look at my solution of makeMontage.m – this is not exactly the file I worked with in class, but follows exactly the same logic.
-
for
returnTimecourse()there is a way you could handle multiple voxels in one go for indexing. The ideas you have to work with are: -
idea 1: only partially reshape the 4d data. Eg an array that is 64x64x24x160 can be reshaped into a 2d array where the first dimensions is all of space, and the second dimensions is all of time. That’s like turning the 3d image at each time point into one of the data “snakes”.
% load 4d data
data = niftiread('filtered_func_data.nii.gz');
% reshape ...
sz = size(data);
sz_space = sz(1)*sz(2)*sz(3)
sz_time = sz(4)
data_snake = reshape(data,[sz_space sz_time]);
size(data_snake)
-
idea 2: turn the 3d voxel locations indices (sub) to linear indices (ind) using the matlab function
sub2ind() -
you will need the
sz_spaceto know how to turn e.g. a list ofx,y,zvalues into the linear indices…
x = [30,31,32];
y = [5,5,5];
z = [2,2,2];
t = [1, 1, 1];
linear_idx = sub2ind(size(data),x,y,z,t);

% then
tcourses = data_snake(linear_idx,:);
% make sure they are columns
tcourses = tcourses';

figure()
plot(tcourses);