learningMatlab
imaging-01
In this unit we complete a simple interactive viewer program for displaying 3d (or even 4d) imaging data. Matlab has powerful functions / toolboxes to make this quite straightforward and I hope I’ll be able to show you that in less than 50-100 lines of code you can build a pretty cool little utility. Building the whole thing from scratch takes a bit more than a couple of sessions, so the aim here is to concentrate on a couple of key functions.
Specification for image viewer
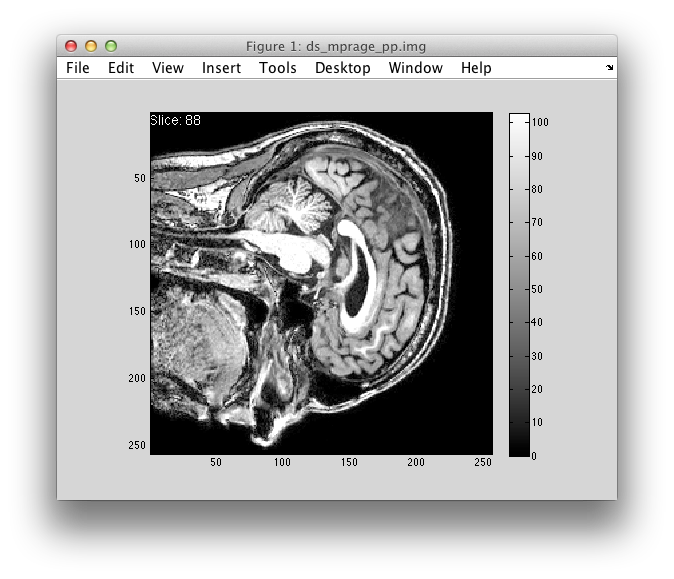
The user starts the program from the Matlab command line by typing sliceview(), which then automatically loads in an image from a file in the current folder. By default, the program then opens a figure window, selects a 2d slice half-way through the 3d image in a particular orientation and displays it as a grayscale image (with a color scheme/range that stays fixed) and a colorbar to show how image intensities map to colors.
-
When users press the up-arrow key, the image viewer skips to the next slice. Down-arrow for the previous slice. There is a white text label in the top left corner of the image that displays the current slice number
-
When the user presses ‘o’, the the orientation in which the 3d image is “sliced” changes: sagittal -> horizontal -> coronal -> …
-
When the user presses ‘q’ (or the Escape key), the the figure window is closed.
-
Help: The program also provides simple help on the command line, reminding the user what buttons to press to skip through slices, to change orientation, and to quit:
==============================================
 Press the following buttons to:
up/down change slice
o/O change orientation
c/C change cursor
q/Esc quit
==============================================
Data
The image to be displayed in stored in a MAT file called anatomy.mat in the current folder The MAT file contains two variables:
- one called
array, a 3d-array containing the image volume; - another variable called
hdr, astructwith many fields, containing information about the stored image, including the filename of the original image, image dimensions, voxel sizes, etc.
Helpful commands / concepts
The following information should help tackle the problem:
-
each figure (handle) comes with a field called “UserData”, which you can use to “attach” data to the figure
- the “KeyPressFcn” field of the figure
- the idea of callback functions and figure handles (explained in lecture)
structfor keeping multiple disparate bits of information togetherimagesc,min/max(orprctile),colorbar,squeeze
Future features (things to think about)
- if the image is not a neat cube (but, say, has dimensions 176x256x256, what’s a potential problem of switching orientations?)
- specifying a data file name as an input argument
- allowing the user to pass in a file name or an actual 3d array of data
- allowing the user to pass in a 4d array (functional MRI data) and displaying a particular time point
- adding functionality with mouse-clicks: when the user clicks on a voxel, some information is displayed in the command line
Aim
In this unit we complete the sliceview() program so that it can work like the solution I have provided. In order to get this to work, you’ll need to write a function called returnSlice() that does the following:
s = returnSlice(array, sliceNum, orientation)
sshould be a 2d array (a slice)sliceNumis the slice we want to get out inorientation(1, 2, or 3 for now)
What are the things to worry about / check to make sure this function is robust and does the right thing?
Notes
- check the
interact.mprogram to see how we can attach interactivity to the matlab figure window sliceview.mis the nearly complete program… all it’s missing is the functionality ofreturnSlice()- you can either provide this as a separate file (the way you are probably used to) or inside thesliceview.mfile itself.