Since I first put up a map of traffic accidents / casualties at the start of October ’21, the Department for Transport has updated its openly accessible data. This means that now data for the years between 2016 and 2020 is easily accessible.
I think knowing when accidents are most common is as important as known where they occur across our county. In this blog post, I will look at that data.
When do most accidents happen during the day / week?
A look at the pattern of accidents in Nottinghamshire (not just West Bridgford) over time is quite revealing - it provides quite a bit of additional insight to what we already learnt from the map view from a previous post.
In particular, let’s look at the average pattern of pedestrian and cyclist casualties during the day and across the week (over the last 5 years).
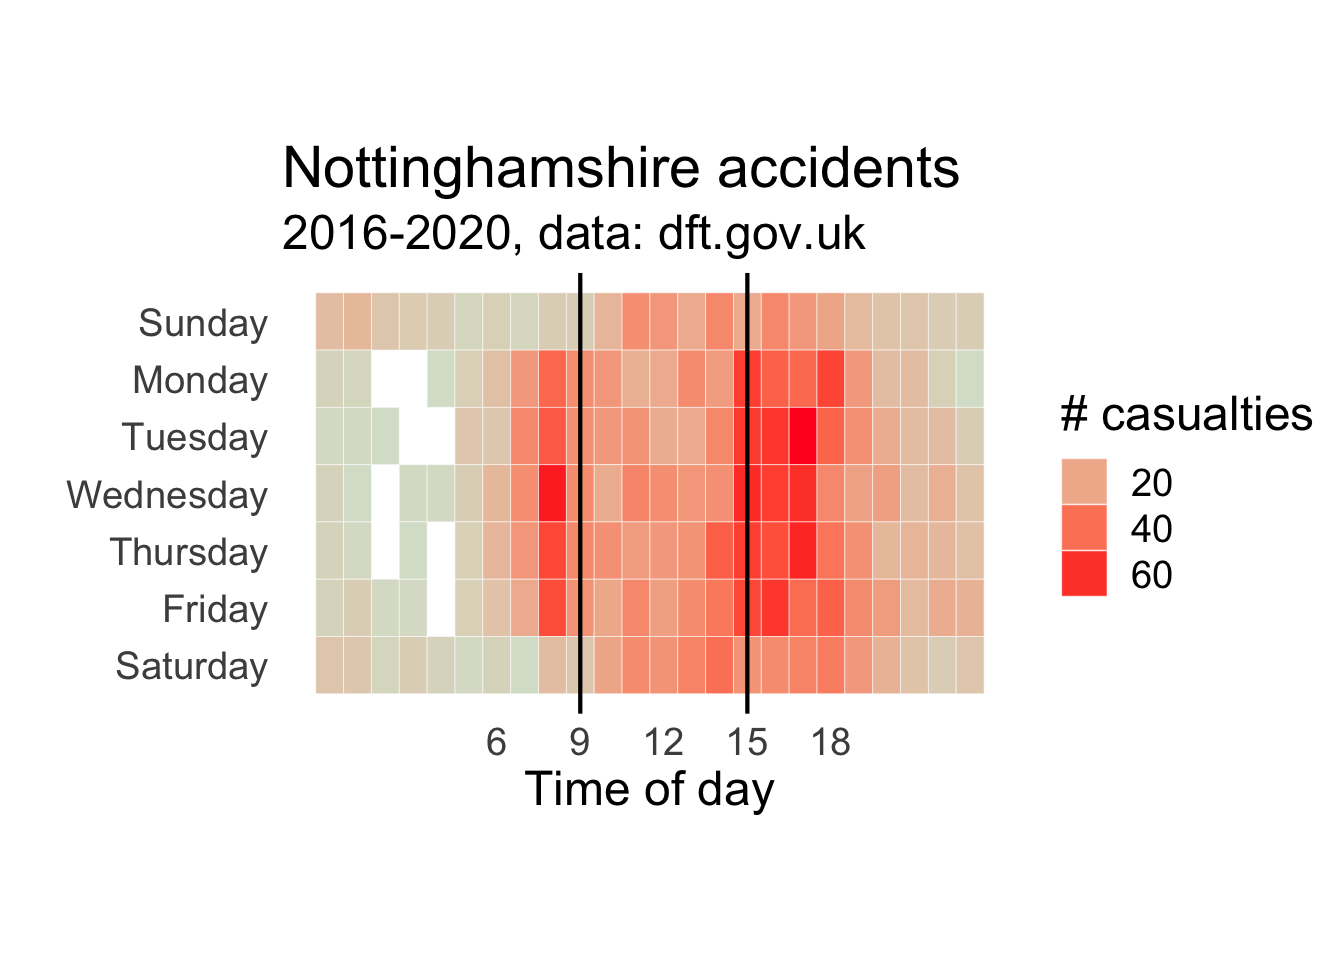
the heatmap plot shows more casualties on weekdays around 9am and just after 3pm - the times when lots of people are on the road – commuting to work and getting to and from school: the more red the colour, the more accidents happened. Each row corresponds to a weekday (top: Sunday) and each column to a one-hour slot during the day (starting at 0000h on the left).
maybe not surprisingly, weekdays are worse than Saturday/Sunday
What age groups are affected when?
One important question for me was:
Are there times of day that are more dangerous than others? What do the data from the last 5 years show?
The distribution of pedestrian and cyclist casualties over the the span of the day, also taking into account the age group, shows a very clear pattern:

the largest number of accidents occur around 9am (900h) and around 3pm (1500h): there are peaks in the histogram plots close to those times - I have added vertical lines to label 9am and 3pm.
especially in the afternoon (3pm onwards) a large number of those younger than 20y are affected: the peaks in the first row of plots (cyclists on the left, pedestrians on the right) are much larger.
the peak times for accidents in 21 - 55 year olds is shifted to slighly later. This presumably reflects the later commute times compared to school finishing times.
Food for thought!
Reality check: 2020 & COVID?
For the map shown below, data from the stats19 database now represent the 5 year period of 2016-2020.
as before, I have merged the “casualties” and “accidents” tables available from
stats19to combine information of who got injured and where the accident occurred.key: pedestrian casualties in red, cyclists in magenta, others (such as people in cars) in blue.